

It's that time of year again when NMHC publishes its lists of the top 50 owners, operators, and various other categories of multifamily companies. It's invaluable information: multifamily companies are notoriously difficult to track, so we should all appreciate the fine work the NMHC research team does to compile and publish the lists each year.
The lists help us to understand what's happening in the industry, and this year, we see a continuation of a trend reported in these pages a year ago. 2023 was the first year in recent memory when there were no REITs in the top ten management groups. That prompted me to analyze the makeup of the top 50 managers and owners in previous lists, all the way back to 2013.
The lists showed a clear pattern of change: the average size of the top 50 management groups had increased by 58% in the decade leading up to 2023, while the top 50 ownership portfolios had decreased by 17% on average over the same period. Although the growth trends go in opposite directions, they are mostly explained by one thing: the interest rate environment during most of that decade.
Favorable lending conditions brought many new owners into the industry, which is reflected in the lower average unit counts for the top 50 companies. On the other hand, the disproportionate growth in management portfolios mostly reflects the growth of third-party management as a share of the industry.
The important takeaway is that today's "average" multifamily property belongs to a smaller ownership portfolio and is more fee-managed than it would have been a decade ago.
What this year's numbers tell us
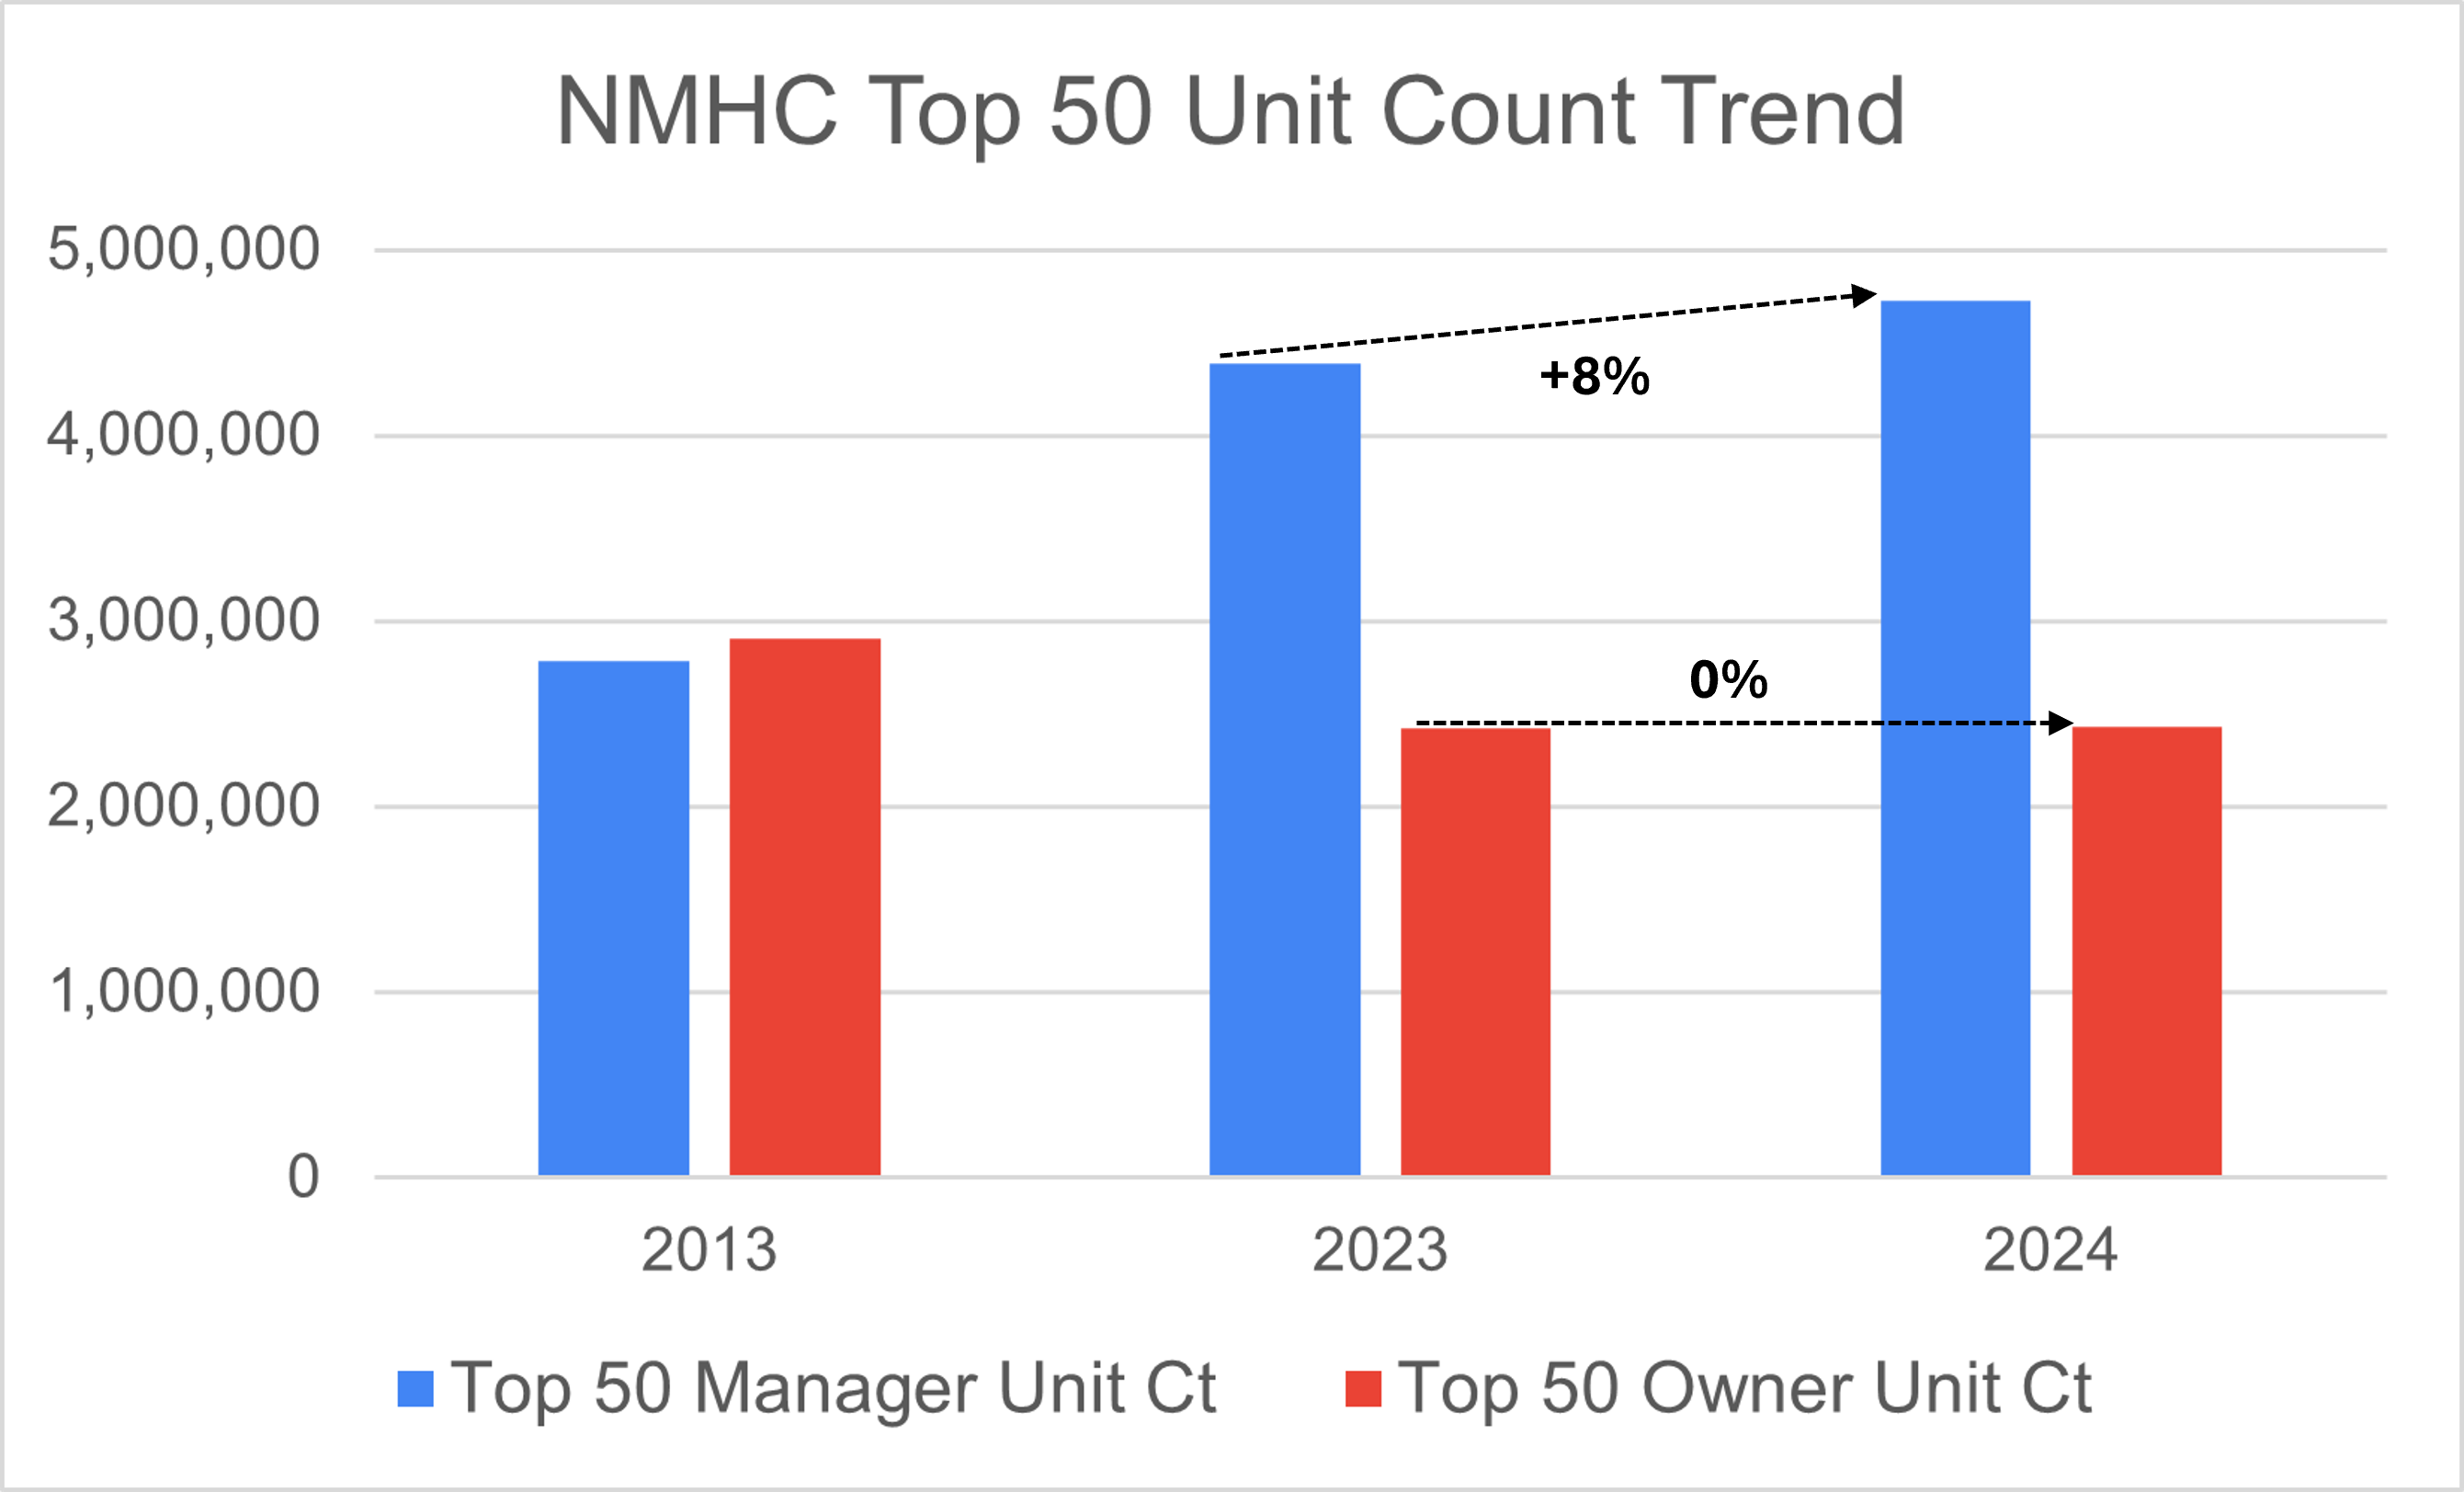
The first chart (below) compares the top 50 owners and managers. Although the average size of ownership groups stayed about the same from last year to this year, management portfolios grew by 8%. Although the size of ownership portfolios did not shrink (as it has over the last decade), the gap in size between ownership and management portfolios is growing.
The 2013 numbers are included for context. 11 years ago, the average top 50 owner owned more units than the average manager operated. Those days appear to be long gone!
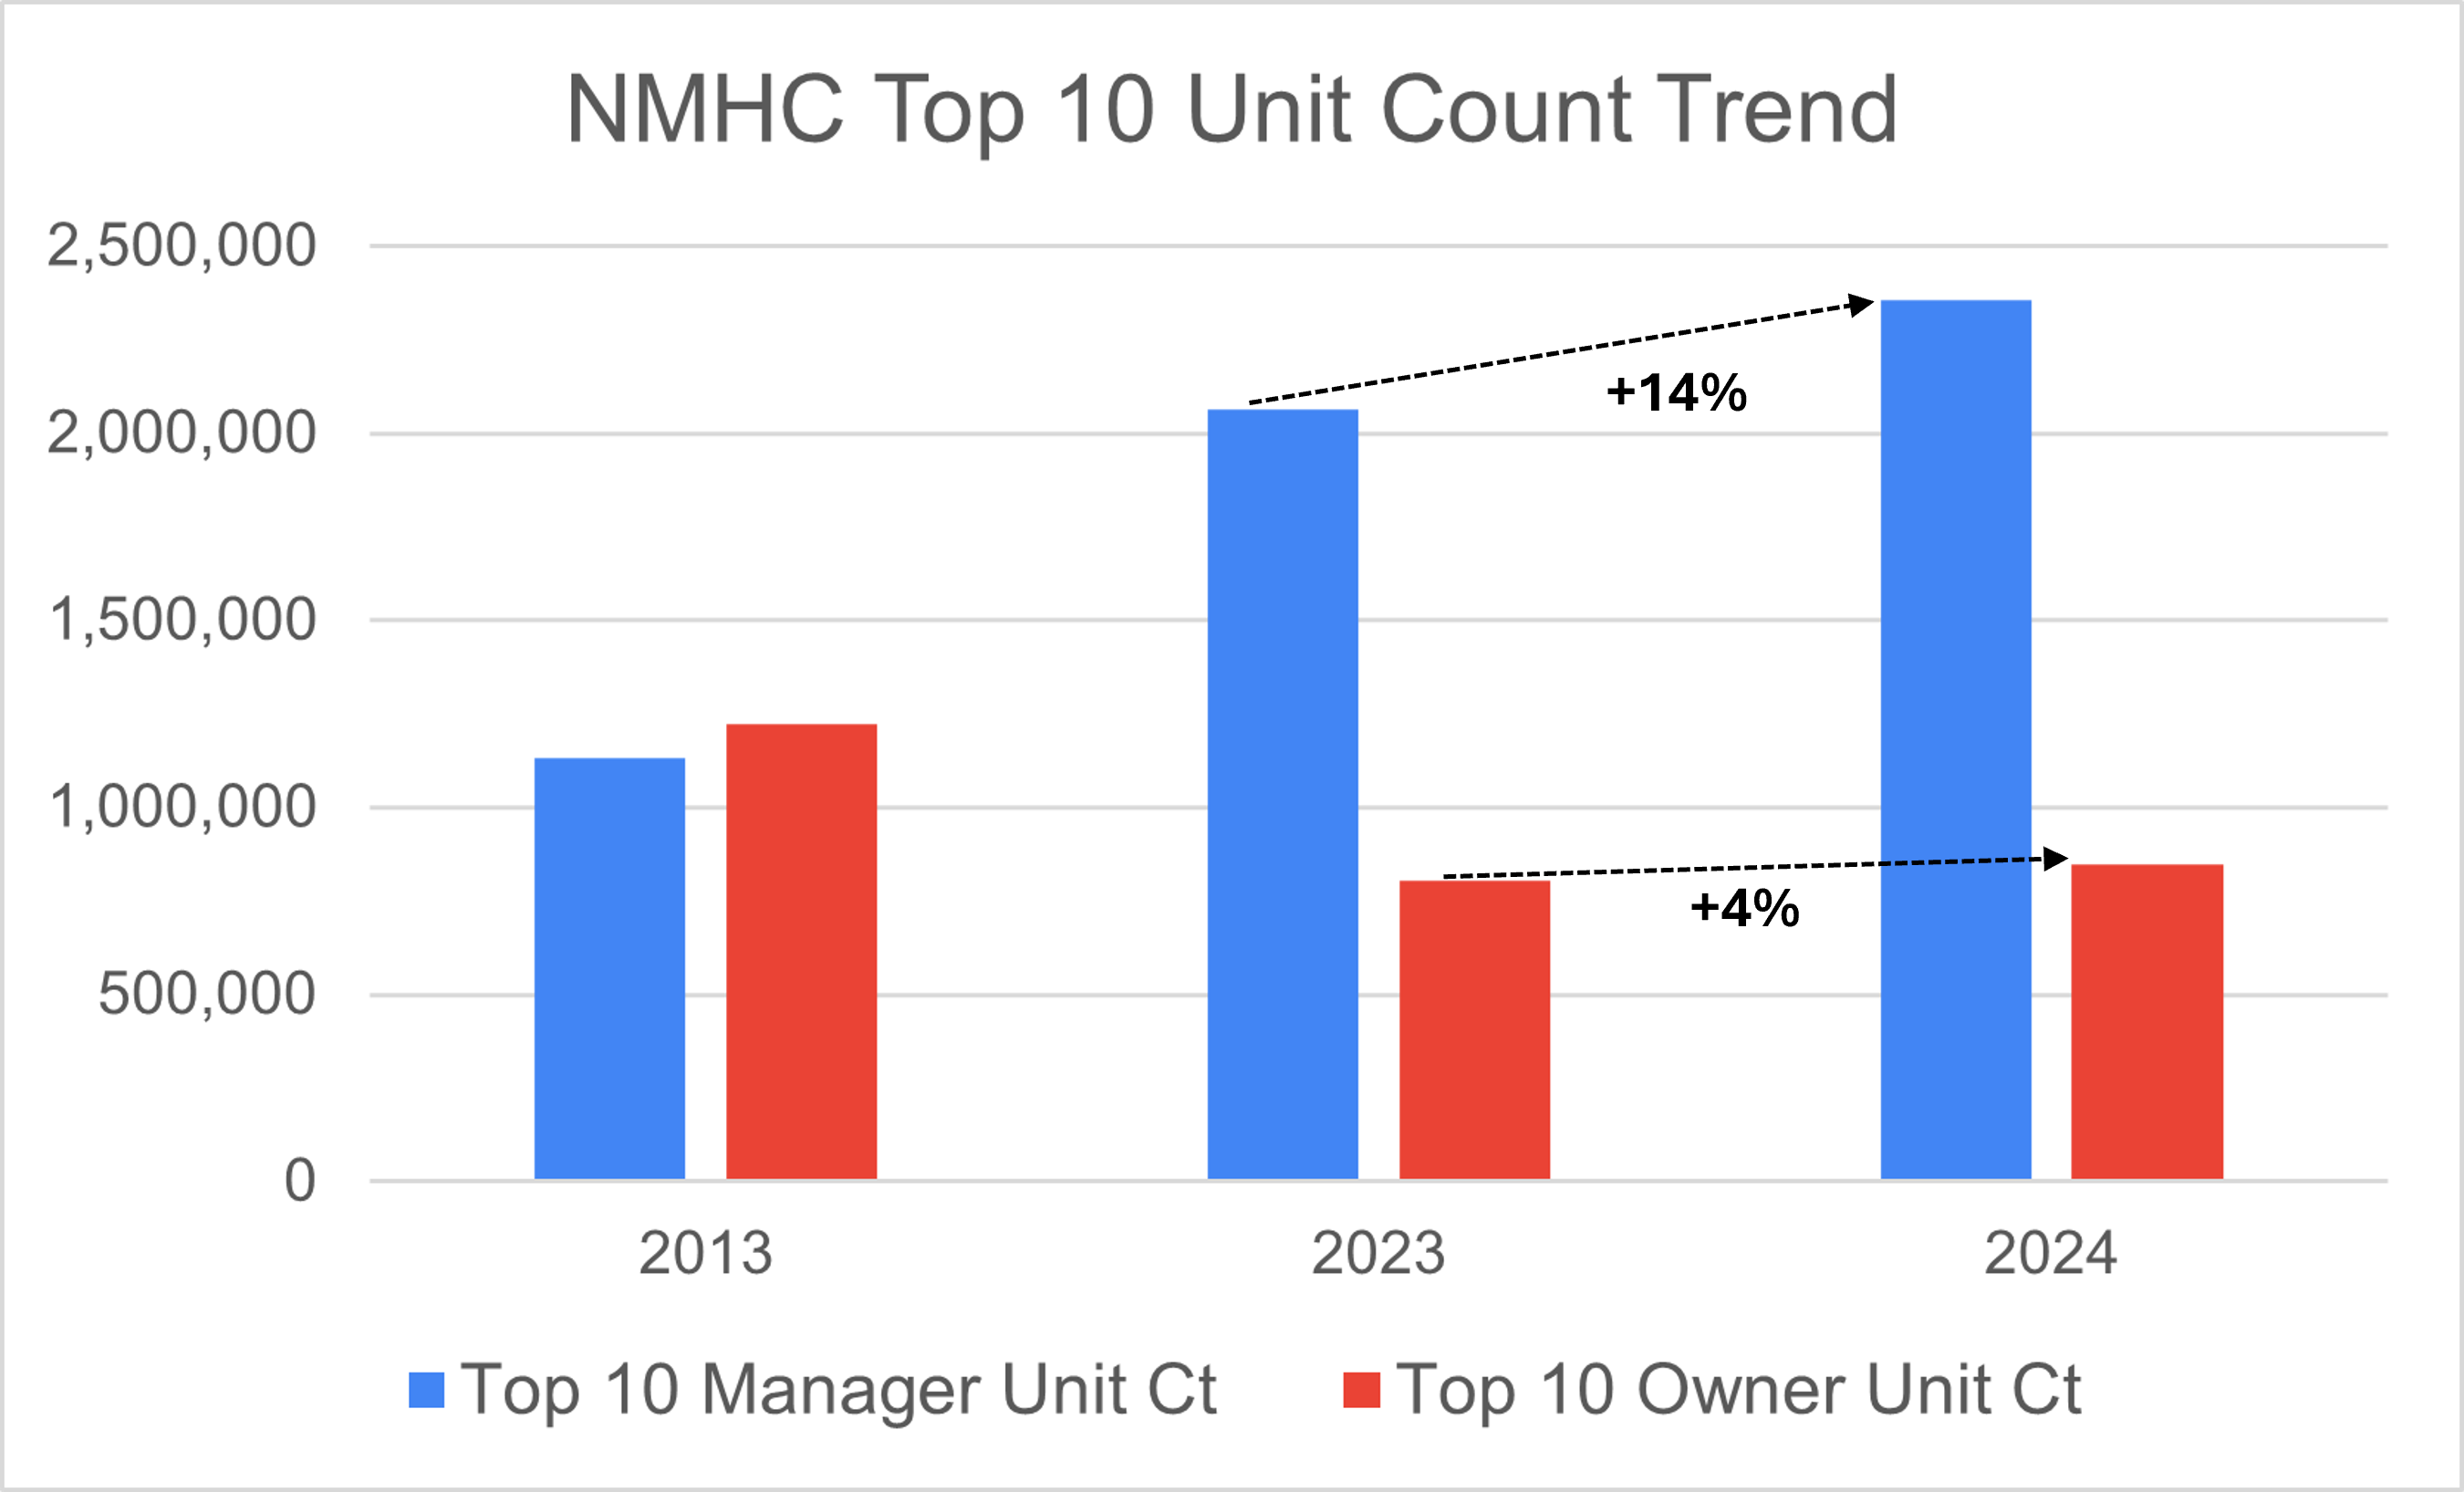
Narrowing the analysis to the top ten on each list provides another important insight (see below). The top ten managers' portfolios grew 14% year-over-year on average, compared to a 4% growth among the top ten owners. Not only is the average multifamily property increasingly managed by a third-party operator, that operator is increasingly likely to be big.
Over the last year, I have written a lot about the evolution of our industry toward third-party management. It has important implications for things like technology adoption, as decision-making processes and motivations are more complicated in an environment where both owner and operator are involved in the decision, as I explained in detail in an article in Thesis Driven a few months ago.
Conventional sales and marketing approaches emerged in an environment where REITs and large owner-operators represented a bigger and more dominant share of the industry than they do today. The multifamily technology footprint has grown in scope and complexity as the industry structure has changed. Sales and marketing approaches should reflect these important shifts.
The remarkable growth of companies like Asset Living and RPM in recent years (and, of course, Greystar over a longer period) explains much of the growth in the top 10 operators' average portfolio size. It also strongly indicates another shift that is likely to happen in property management in the not-too-distant future.
What this has to do with centralization
Last week's post speculated on the crucial role of third-party managers in redefining property operating models as the industry progresses toward a more centralized future. The NMHC Top 10 statistics suggest an exciting opportunity: centralization offers third-party managers economies of scale that have never before been available.
The legacy fee management model, where properties are staffed according to a coverage model and staff costs are billed back to ownership, offers relatively little leverage to companies operating many properties. Centralization offers the opportunity to provide specialized services, where the owner pays the operator for the service rather than hiring people to do all of the tasks onsite.
Larger companies should be able to drive greater efficiencies in service delivery, meaning their size will become a greater advantage than it is today. Over the next 18 months, it will be fascinating to see how quickly third-party operators (especially the big ones) gain traction with the new commercial models necessary for centralization to take hold.
Thanks once again to NMHC for delivering another year of invaluable insights that I look forward to monitoring as we progress through 2024.

Photo by Mac Mullins on Pexels