

A couple of weeks ago, NMHC released its annual lists of the top 50 multifamily owners and developers. As usual, the lists provide an excellent touchpoint on the state of our industry. This year's lists disclose something interesting about a changing industry structure.
Technology buying behaviors have been changing for a while in our industry, for reasons I explained in the previous two editions of 20 for 20. In this post, I will describe what the NMHC data tells us about industry structure and what that has to do with tech decision-making.
The Changing Face of Management
2023 was the first list I have seen where none of the top ten managers is a public REIT. I went back through the years and found this has been a developing trend over the last decade. Ten years ago, three of the top ten and seven of the top 20 managers were REITs. All of this year's top ten managers are third-party managers.
This observation made me curious to know more about the overall trend in both management and ownership. The table below compares the portfolios of the 2023 top 50 to the equivalent numbers from 2013.
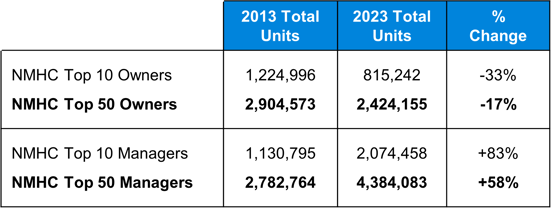
First, the average ownership portfolio size has shrunk in the last decade. The total unit count for the top 50 is 17% lower than it was a decade ago, with the top 10 down 33%. These numbers tell us that an already fragmented industry is becoming ever more fragmented. That is a good news story in a growing industry because it suggests the generally favorable financial environment led to an increasing number and diversity of owners.
At the same time, the average portfolio size of the largest managers has grown substafntially. The top 50 managers increased unit count by 58% in the last decade, and the top 10 by 83%. That the top 10 has grown so much is mostly due to consolidation among some of the largest players. But all 50 portfolios grew at an impressive rate, suggesting this is a general trend.
What this has to do with technology
Managed portfolios have been getting way bigger, while owned ones shrank on average. The REITs are absent from this year's top 10 not because they shrank in the last decade; they have mostly grown. But fee management has been growing faster.
More third-party management and greater diversity of owners means that decision-making is changing. Fee managers are, of course, responsible for running the properties they are hired to operate. But almost all decisions relating to a property's strategy and financial planning ultimately lie with ownership groups. And that group seems to be getting more diverse.
As I pointed out in 20 for 20, there is reason to think that future technology decisions will differ from past ones. For most of our industry's recent history, technology sales and marketing efforts have focused on the COO and the head of technology of owner-operators. With fewer stakeholders involved, these executives can make portfolio-wide technology decisions.
But with a more fragmented base of owners and operators, decisions become less centralized, especially for technologies that involve deploying physical equipment into buildings (think smart tech, connectivity, etc.). A decision to retrofit proptech into a community, for example, is likelier to be taken by a combination of asset management and regional management than the company's executive management.
This shift has important implications for the long-term technology adoption in our industry. Vendors should not expect the same business development strategies and playbooks to work when the buyer personas are changing. They are changing due to the growing footprint of technology: more tech means more tech decisions means more decision-makers. And—as the NMHC numbers suggest—the will increasingly reflect changing composition of our industry.